Analytics. Love ’em or hate ’em, understanding what you’re looking at in the analytics section of Pinterest is key to improving performance. Lucky for us, Pinterest makes it pretty easy to understand what’s going on in our accounts and how to tweak the default values shown to learn how to get more of the results we want.
Even so, on your first time in, the terms and zig-zag lines and arrows might be a little overwhelming, so let’s take it from the top and cover just the first section here, “Your Pinterest Profile.”
Your Pinterest Profile
This is the first section you’ll notice on the left when you enter the Analytics Overview and it’s a look at all your pinning activity – whether you’re pinning your own content, repinning someone else’s pins, or pinning from someone else’s website.
You’ll see a snapshot of the trends on your pins from the past seven days. “Impressions” means how many times your pins appeared in someone’s feed, category feeds, or search results. That doesn’t mean, though, that pinners actually saw them – that’s what “Viewers” is for. Obviously, Pinterest can’t say for sure that eyeballs actually landed on those pins, but it’s a fair guess and will always be lower than the impression count.
The Impressions Tab
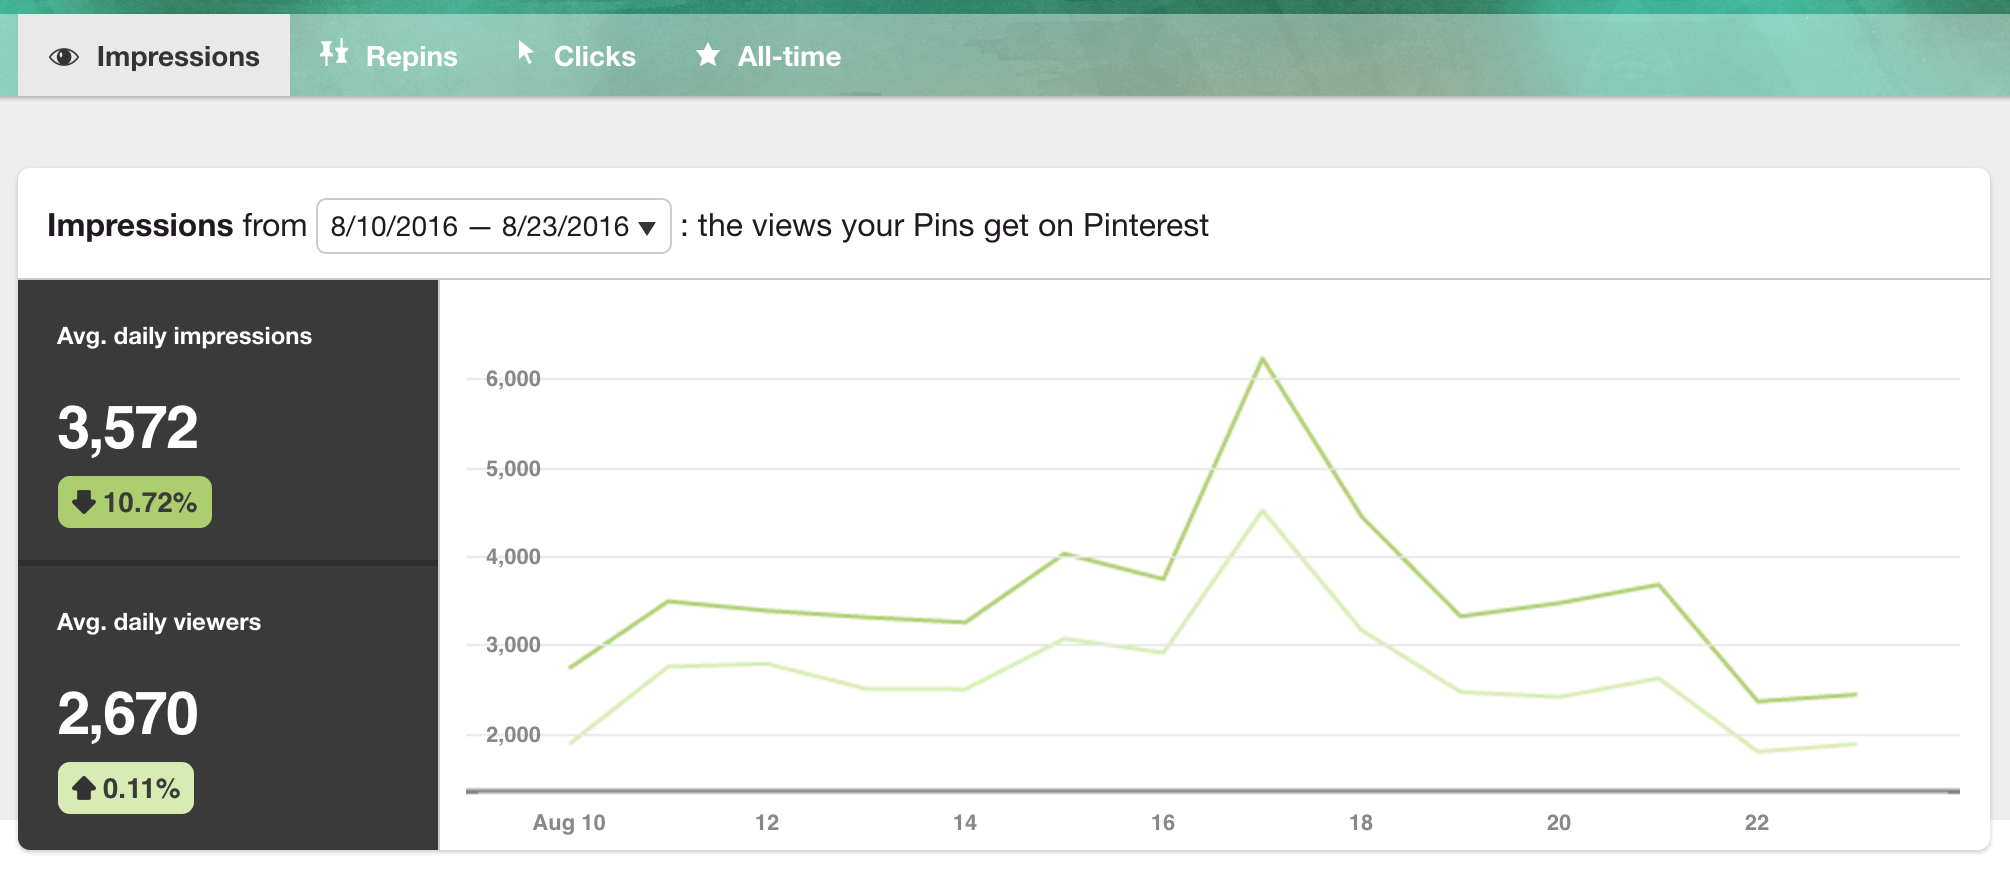
Click through for more and you’ll see figures for impressions that took place over that past two weeks. You can always adjust the time period for the report from the drop-down menu. Expand the date range and look for seasonal dips and rises or changes which coincide with modifications to pinning or blogging strategy or frequency.
Hack: Notice in the upper right corner of your screen (not pictured below), you’ll see a drop-down button for “all apps.” This allows you to filter impressions by devices if you like. This might be important to you if, for example, you know most of your signups or sales come from iPhone users. If that were the case, filter to see just that data likely to make the biggest impact on your sales and signups.

See that jump in my numbers? These charts do typically jump up and down and aren’t too terribly helpful in understanding what is working and how to improve your account. Rather, that insight comes from the pin and board information OR from viewing trends over a longer time period.
Below this chart you’ll see pins with the most impressions and then boards with the most impressions in the past 30 days. Again, pin impressions simply means how many times your pins (whether your own content or someone else’s) appeared on someone’s feeds.
Next you’ll see Boards with Top Pin Impressions. These are boards you either created or contribute to. Pins you add here are getting more exposure than those on other boards. Pin more of your content to these boards!

Note: Check out the “pin type” in the row with your top pins. “R” stands for “rich pin” and “P” for “promoted pin.”
The Repins Tab
Click on the Repins link to see repin trends and how many times your top pins have been repinned and which boards are generating the most repins. Repins leads to greater exposure over time, so pin your own content to boards which give you the most repins – and model your own images and descriptions on any which are being repinned frequently.
The Clicks Tab
When you go to the Clicks link, prepare to be befuddled. It very clearly says that what you’re looking at are pins and boards that sent visitors to your website. But, if you look at the pins in the list, I bet most of them don’t go to your site! It’s clearly an error.
Still, it is helpful to examine the types of images and descriptions which generate the most clicks. Look for themes and best practices you can use on your own pins!
Hack: Export this report and take a look at the sites getting clicks from your pins. What are they doing well with their content and images? Can you incorporate some of the ideas you pick up into your own content?
The All Time Tab
Click on All Time and you’ll get a from-the-beginning-of-time view of your best pins on Pinterest. On the one hand, having this data is interesting. On the other hand, Pinterest changes, trends come and go, so, how useful is all of this for TODAY?
Most Saves are pins that have been repinned (I know, this mix of “save” and “repin” gets confusing). While this is interesting, again, with no date information, what was big three years ago might get crickets today.
Best in Search defines itself – Pins that appear higher in search. This may be useful. Analyze your top pins here. See what you can learn and emulate what is working. Export your report and quickly identify if pins from certain websites are appearing multiple times. Pin more from there and create similar content for yourself!
Power Pins. Am I the only one who loves that term? I bet the pins here will surprise you! Now that we have aggregate repin counts, it’s hard to see exactly how many times YOUR pin was repinned, but Pinterest is telling you – this is what works on Pinterest. Do more of this. 🙂
Pinterest “Your Profile” Analytics Takeaways:
Examine your top pins. Do you see a theme in either the design or the subject matter? Can you pin more content that is similar? Better yet, can you create your own content that is similar? When looking at top boards, make sure you always pin your content there. They’ll likely generate the most activity for you.
Look Deeper
For a closer look at your top performers, export the report and open the spreadsheet. You’ll see data such as the exact numbers by day, the date a pin or board was created, and more.
Hack: You can then also run your own formulas to see what kind of click through rate each pin receives. Cool, right?
How have Pinterest analytics improved your pinning?
Related Posts
Latest posts by Alisa Meredith (see all)
- How Much Do Pinterest Ads Cost? - December 10, 2021
- Surround Sound Marketing – The Content Strategy of the Future - November 29, 2021
- How to Build Your Business with Word-of-Mouth Marketing - November 18, 2021


